

Monday just happened. I’m sure it happened to you to. That’s why this is being sent today… on Tuesday.
We are only through 5 of the 30 Days of CRO, and we gotta keep moving on so let’s get back to it…
On Friday, we left off by starting a few page snapshots. If you recall, it was for 2 top product pages and 1 collection page, and I want to start with the collection page first.
The Collection Snapshot
Most traffic is going to land on your Homepage, a collection page, or a product page. The last one - product pages - are closer to checkout, and therefore, more important for CRO than other pages (typically).
The collection page, however, shows you more about your customers shopping habits and intent. It shows you:
a) what they are looking for
b) how they are looking for it.
We will look at the results page for a MW collection snapshot in a minute, but first, let’s hit the peace pipe.
side note: I worked with a couple cannabis/hemp companies, and I learned that in regulated industries, the collection pages are more important than in non-regulated industries. Because regulated products are usually banned from adverting platforms like meta and google, which makes organic traffic (SEO) the lifeline for traffic acquisition.
So the focus shifts.
On top of the merchandising, filters, navigation, speed, etc. that all collection pages need, regulated product sites also have to focus on keywords and content.
Product categories often dictate priorities.
Benchmark
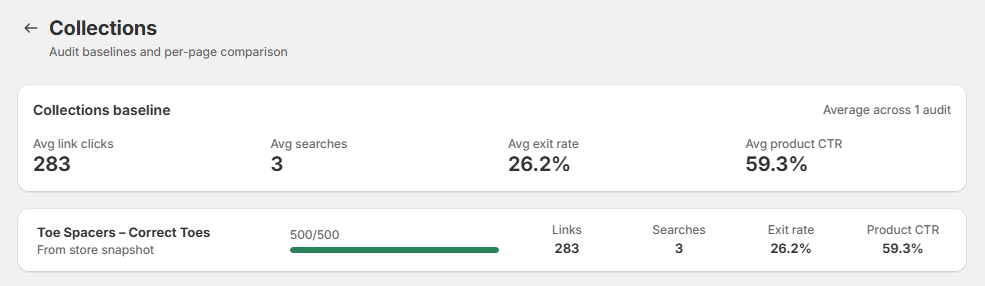
That image above is what you see when you click on the Collections tab in MW. And right off the bat, you’ll see the high level overview
- 500 human visitors
- 283 clicked to view a product (59%)
- 3 people used the search bar
These will be our own benchmarks for subsequent snapshots.
Snapshot Results
What I like about these snapshots the most is that it is Sequential Testing. It is not an AB test because there is no B. It’s just your A game…
AB Testing is great when you have a variable to test, but you might not have a variable to test because you might not know what people are doing on or clicking on that page.
Or you might have just launched. Or traffic is too low to test but you still want to know what’s working or not.
These snapshots results in a bunch of fun signals for you to analyze.
This video walks through all the data that is collected. It aims to be a comprehensive look at your on-page engagement based on data (signals) that you can actually act upon… depending on what you are trying to optimize
Snapshot Results
Traffic Quality (Real Users vs. Zombies vs. Bots)
Traffic Source Segmentation
Engagement Funnel
Link Clicks
On-Site Searches & Top Queries
Exit Rate & Exit Paths
Product CTR & Top Products Clicked
Average Time on Page
Average Scroll Depth
Top Countries & Cities
Device Breakdown
Filter Usage
Engagement by Zone (Body Click Map)
Header & Footer Click Maps
Recent Visits (Session-Level Journeys)
Woooooahh that is a lot. Just kidding. When you run this, you will glean insights and ideas from several metrics, and some others will just be good to keep an eye on as changes are implemented.
Here are a few ideas to go with each type.
CRO Ideas for Each
1. Traffic Quality (Real vs. Zombies vs. Bots)
This shows the conversion rate using only real users for accurate benchmarks. If you have a high number of zombies, that’s a problem to work on, but that is a separate line of optimizations that may lie outside the page.
2. Traffic Source Segmentation
Compare product CTR by marketing channel; if one channel is underperforming compared to the others, there is an issue to dig into.
3. Engagement Funnel
Find where the big drop-off is and focus on that step. Then fan out.
4. Link Clicks
If you get low link clicks, your page might be a dead-end. You might need internal links or other calls-to-action. Or you might remove links that get ignored so they dont confuse shoppers.
5. On-Site Searches & Top Queries
Searches are gold. They show what people want but can not find, and a really high search volume means the merchandising sucks.
6. Exit Rate & Exit Paths
Closed Tab exits are double-plus ungood. So if that is high, test around that first, then work your way down. Except for idle sessions… someone may have spilled coffee on their lap while shopping.
7. Product CTR & Top Products Clicked
Feature your most-clicked product above the fold, and test new product photos for products with low clicks despite good placement.
8. Average Time on Page
Short time with a low CTR means you got no hooks; short time with high CTR is is good and you should move on.
9. Average Scroll Depth
Good to know, and good to keep an eye on. Because sometimes you might want to move sections high up if your scroll depth has no depth.
10. Top Countries & Cities
Ashburn or Counsil Bluff are usually crawler traffic… the rest is good if you sell internationally.
11. Device Breakdown
This is obvious
12. Filter Usage
Filters are great IF they are needed. Not all stores need them. But if you have a huge catalog, this is a huge component to keep an eye on.
13. Engagement by Zone (Body Click Map)
This is #13 on this list but its #1 or #2 on my list… because you want to know where the action is taking place… so you can be there.
14. Header & Footer Click Maps
Separated into their ow boxes for quick reference.
15. Recent Visits (Session-Level Journeys)
These are there for when you need to get granular. One of the least insightful areas because it is so anecdotal, like watching session recordings, but nevertheless handy when you need it.
16. Snapshot Comparison
Run subsequent snapshots to measure changes and see if your optimizations actually worked!!
That is all for now!
- Shep
Oh wise Shepherd, how does one improve their google review score when it seems only the aggrieved sing the quality of their experience?
Thanks,
B. Of Falcon City via Amarillo, TX